Sonogram Directivity Results
How Does It Work?
Acoustic Diffusion is not an easy thing to test or describe. In fact in the academic acoustics world there is a big controversy about the best way to describe and measure diffusion: the Scattering Coefficient or the Diffusion Coefficient.
“You will know it works when you hear it,” is true but probably not a good explanation. I am going to avoid this whole dispute by publishing the actual data of all frequencies and amplitudes in my tests.
I did several rounds of acoustic testing on the Ramps and here is what I found:
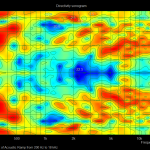
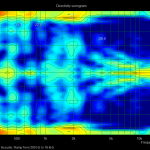
- The Acoustic Ramp scatters frequencies horizontally from about 300 Hz to about 4000 Hz (4kHz), but doesn’t do a lot below or above this bandwidth
- The Acoustic Ramp scatters and reflect frequencies vertically from about 300 Hz all the way up to 20000 Hz (20kHz)
The Ramp does both of these things at the same time. So if you install the diffusers on their sides, it only changes which orientation scatters and which one reflects and scatters.
Why Do We Want To Scatter the Sound Anyway?
When sound strikes a hard flat surface most of the sound bounces off the wall as an echo. That echo can interfere with the sound that is headed towards the wall by cancelling out certain frequencies and emphasizing other frequencies. This effect is called comb-filtering. You just cannot hear sound accurately in a room that has comb-filtering problems. Scattering the sound breaks up echoes into many little tiny echoes diminishing their effect. The Ramp also reflects sound away from the sound source, further minimizing the effect of comb-filtering.
Reflections can also be controlled with absorption of course, but absorption-only treatments tend to yield rooms that sound dead and lifeless.
How Do you Read Those Diagrams?
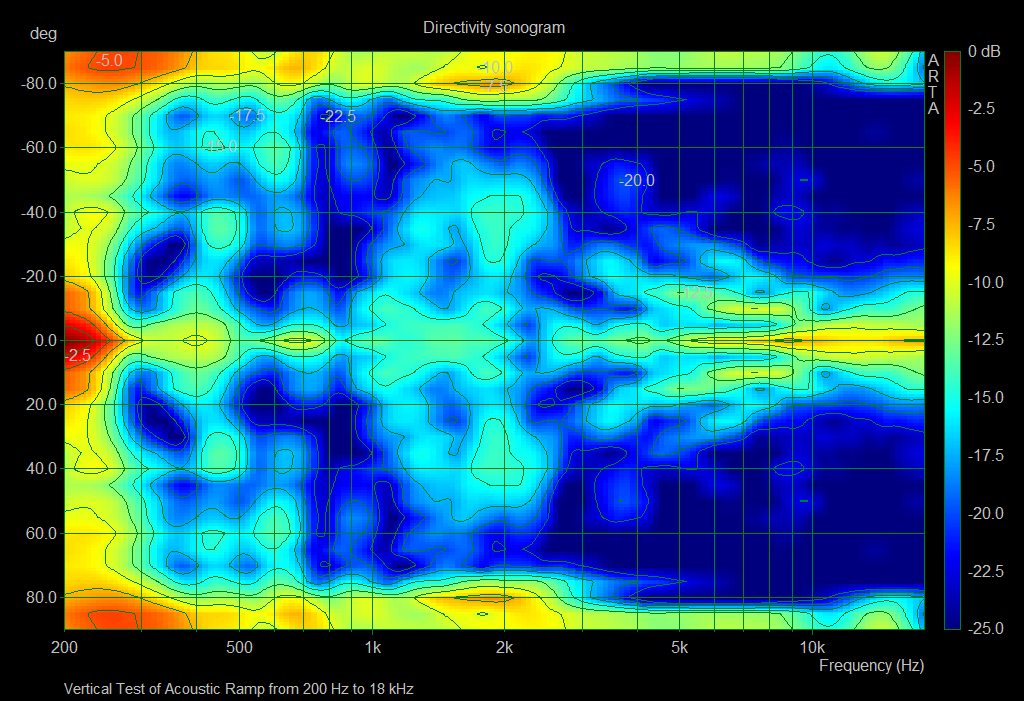
Those diagrams are called “sonograms” and they were generated from data gathered using the software package ARTA. There will be a later post about the testing procedure, but for right now let’s focus on the diagrams.

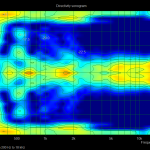
The Sonogram shows Amplitude (color), Frequency (x-axis), and Directivity (y-axis). The above diagram shows what happens when you place a loudspeaker directly in front of a flat panel. The bright yellows and reds show loud levels and the blues and dark blues show quiet levels. The stripe of brightness that goes horizontally across the center of the diagram shows that sound is bouncing right back towards the speaker. At about 500 Hz the sound is bouncing at about 30 degrees and 50 degrees off-center. And from about 300 Hz and below the reflection pattern is pretty wide.
If there is pretty good diffusion at a specific frequency the diagram will show a vertical band of similar colors. Horizontal bands of similar color means that there is an intense specular reflection at a specific angle. For instance, in the above flat reflector model, there is a very strong reflection at 0 degrees, meaning that sound hitting the reflector is bouncing straight back to the loudspeaker. If the reflector had been angled at 45°, we would expect there to be an intense band at around 45° as well.
In the horizontal test of the Acoustic Ramp™ you can see that nearly all of the energy is directed away from bounding back towards the sound source because the center of the diagram shows darker blue colors.
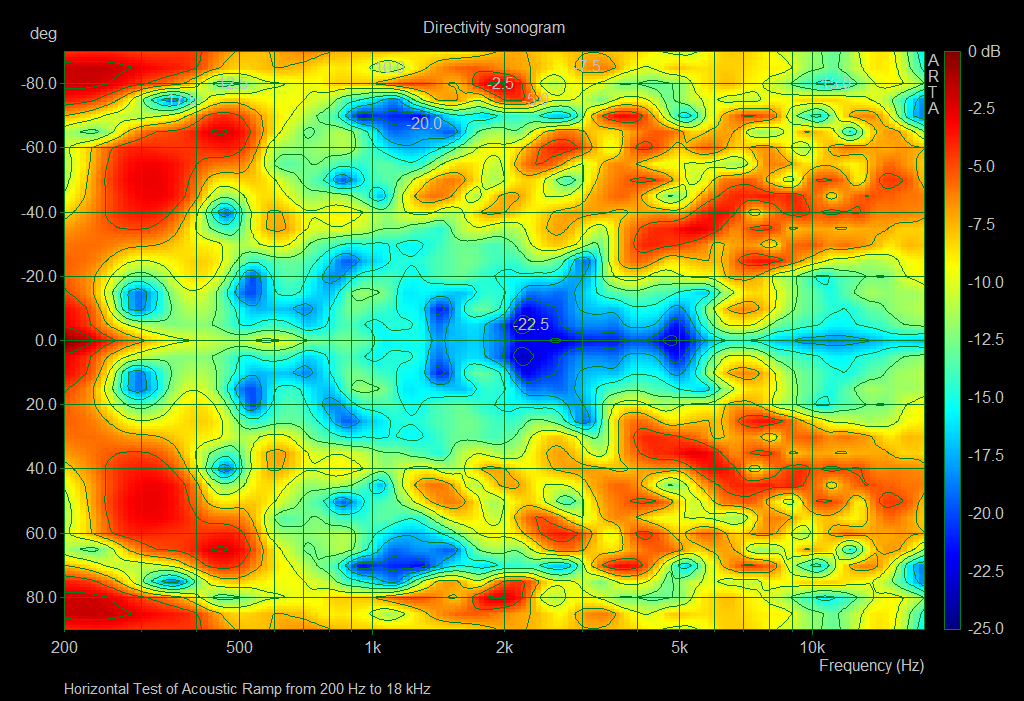
In the vertical test of the Ramp you can see the scattering of frequencies from about 300 Hz to around 4 kHz.

4 replies on “Acoustic Ramp™ Test Results”
isn’t frequency being shown on the x axis?
Hi Lee:
Frequency is being shown on the X-Axis, Angle of Reflection on the Y-Axis and the color temperature is amplitude. I think the confusion is the horizontal versus vertical layout. What I mean is that I positioned the diffuser vertically or lay the diffuser on its side horizontally so I could test both ways. It is very confusing to describe the testing procedure. I hope this helps! Thanks for the comment/question.
I just found and corrected the error that you were talking about. Thanks for the catch!
[…] Hajottaa äänienergiaa kahdessa dimensiossa (data) […]